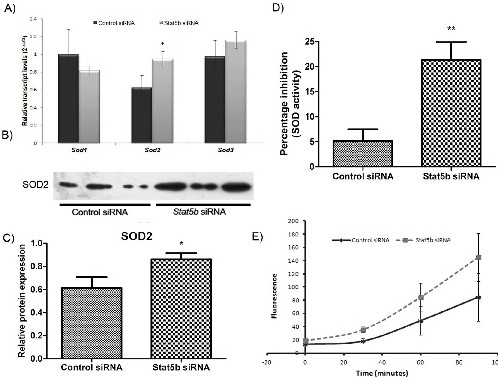
Fig. 4. Impact of Stat5b silencing on SOD2 and H2O2. A) Bar graph representation of increased relative transcript levels (2-ΔΔCt) of Sod1, Sod2 and Sod3 in PRL induced Stat5b siRNA treated MIN6 cells versus control samples, with 18SrRNA as endogenous control (n = 3). B) Western blot and C) densitometric analysis of SOD2 denoting an increase in protein levels in Stat5b siRNA treated samples (n = 3). The bands were normalized using actin in Fig. 1E. D) Bar graph represents the effect of Stat5b siRNA treatment on percentage inhibition activity of SOD on WST-1, showing an increase in SOD activity in Stat5b siRNA treated samples (n = 3). P-value was calculated using Student's t-test on GraphPad Prism 5.0 software. E) Representation of detection of H2O2 released from cultured MIN6 cells treated with Stat5b siRNA versus control siRNA over a period of 0 to 90 minutes. The values show mean and SD of fluorescence from 3 replicates and indicates higher amounts of H2O2 released from Stat5b knockdown samples.